As a kid, and now as a dad, I’ve found myself dabbling in activity books. Connect-the-dots, mazes, word jumbles, and one of my all-time favorites…Spot the Differences.
You know: two similar pictures with differences (sometimes tricky to identify) between them . . .
 I spotted 5 differences. Did you?
In this blog, we’re going to engage in a slightly different, grown-up game of Spot the Differences. Our two “pictures” for comparison are Nielsen Local Television measurement and Comscore Local Television measurement.
Consider this blog the start of a series where we will go under the hood of these two measurement companies to help you better understand how they measure local television viewership.
When looking at these two services there are similarities:
- Nielsen and Comscore are media measurement companies with expertise in a cornucopia of areas
- Both measure television viewing locally and nationally
- Both measure digital audiences
- Both offer qualitative segments beyond age and gender
- Both are working on innovations toward an industry-accepted cross-platform metric
If we look closely though, there are differences that will become apparent.
- Universe estimates
- Operating partners
- Modeling techniques
- Devices used for measurement
- Qualitative audience segments
For this blog, our focus will be on one aspect of the current state of Nielsen and Comscore’s local linear television measurement. Grab your pen and circle TV universe estimates and audience crediting. We’ll look at both from a HH and demo perspective.
HH Universe Estimates
As buyers and sellers of local linear broadcast television, our target audience is people in households (HHs) who own a TV. Each September, Nielsen releases their TV universe estimates for each of the 210 Designated Market Areas or DMAs. They rely on U.S. Census data along with their own proprietary panel research to create their official estimate of how many TV HHs are in each DMA along with how many persons reside within those TV HHs. The universe estimates go into effect at the end of September with the start of the broadcast season.
Interestingly, Comscore has the rights to utilize the same Nielsen TV HH universe estimates. They don’t utilize Nielsen’s demo estimates, but we’ll get to that later.
So, if you were to list all 210 DMA TV HH Universe estimates for Nielsen and Comscore side by side you would see matching counts for every DMA.
To be clear, this does not mean that both companies are measuring audiences in every one of these HHs. This is simply the universe of HHs in which each company will determine their respective HH and audience estimates.
Our first attempt at spotting a difference? Not here!
HH Viewership Crediting
In both services, if at least one person in the HH is viewing a program the HH will contribute to the average audience. Although we’re not exploring it in depth in this blog, here is where we see our first difference. Nielsen and Comscore leverage different modeling techniques and have varied operating partners (i.e. cable & satellite providers) with different footprints. Factors, such as these, influence how the HH viewing estimates are determined for each service.
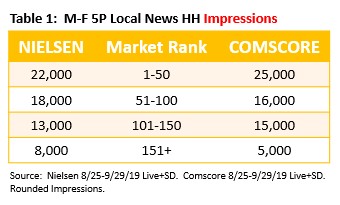
In table 1, I’ve white labeled 4 DMAs of varying market ranks. I looked at a 5P weekday Local News in each market. The impressions reflect HH audience for the News over the same dates between the two services. As you would suspect, we’re going to see different HH averages. The most likely contributing factor to these differences is the measurement and modeling techniques employed by each company. In some cases, the Nielsen delivery is higher and, in some cases, the Comscore delivery is higher. The HH variance between the two is not that substantial.
Demo Universe Estimates
Demographic reporting is a clear difference between Nielsen and Comscore. Nielsen measures and reports on a demographic. Comscore measures and reports on a HH with a demographic.
Earlier I told you how Nielsen estimates its TV HHs and demos. Comscore only leases the TV HH universe from Nielsen. Comscore relies on relationships with third parties to determine the demographic composition of their HHs. Additionally, Comscore does not present their demos from a person-based perspective. Their demos are presented as HHs with {insert any demo segment here}.
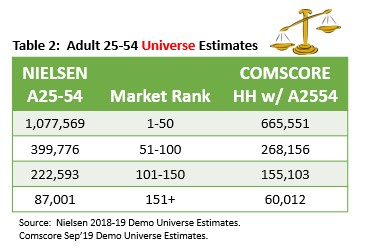
Let’s see how that looks. Table 2 illustrates a comparison of the demographic universe estimates for Nielsen and Comscore within our 4 DMAs.
Spot the difference?
Yup, that scale is tipped in Nielsen’s direction. Nielsen’s Adult 25-54 demographic universes are larger than Comscore’s.
Let’s explore why that’s the case.
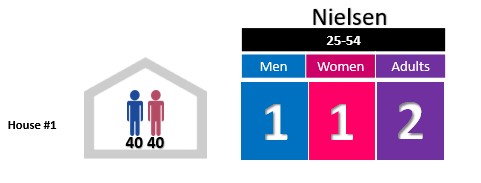
Look at “House #1” in the chart below. A 40-year-old male and a 40-year-old female call this home. Nielsen’s Adult 25-54 universe represents all male and female occupants in the TV household between the ages of 25 and 54. So, each individual from our couple counts as an Adult 25-54, contributing twice to that universe estimate.
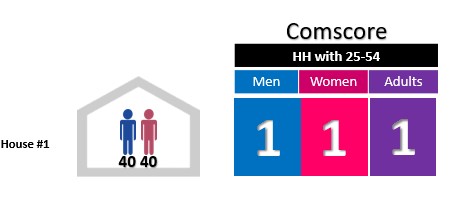
Comscore determines its HH with demo universe a little differently. Imagine our same happy 40-year-old couple. This HH will count as a HH with Men 25-54 and a HH with Women 25-54.
Both the male and the female are within the same age range (25-54). If the HH has the presence of at least 1 Adult 25-54 it will be considered a HH with an Adult 25-54. There can be ten 40-year-olds in the house, and it will still be considered one HH with an Adult 25-54. This makes sense because we’re talking about the composition of the HH.
If we walk down the street to House #2 with two men in the 25-54 range or House #3 with two women in the 25-54 range, Nielsen counts everyone. So, 2 men = 2 adults. 2 women = 2 adults.
Comscore counts the 2 men that fall in the same age range as a HH with a Male 25-54. Again, no matter how many individuals are in the same age range, it counts as 1 HH with Men 25-54 or only 1 HH with Adult 25-54. Same logic for Women.
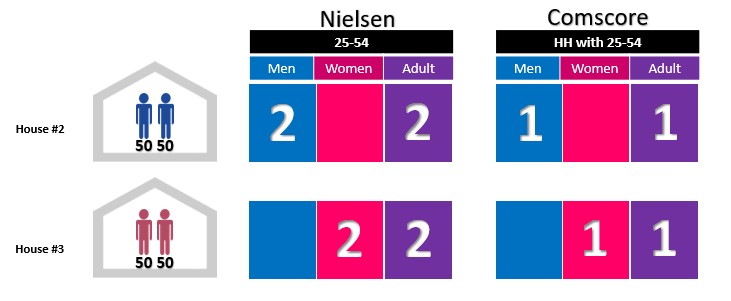
Another difference!
Understanding this distinction of “demo” vs “HH with demo” is key to understanding the differences in reported ratings and impressions from a demo perspective.
We’ve already reviewed how each service creates their demographic universes. There’s just one more concept that needs to be explained – how Nielsen and Comscore credit viewing to a demographic.
One last visit to our 4 masked DMAs. In Table 3 I’ll illustrate the impressions for Adults 25-54 (Nielsen) vs. HH with an Adult 25-54 (Comscore) for the same 5P Local News as earlier.
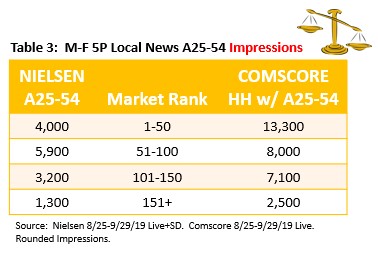
Did you spot that? The scale has flipped with Comscore seeing larger average audiences. Consider Comscore’s crediting as an “opportunity” to view. Without getting into the nitty gritty, Comscore does not have a way to determine which person in the HH is viewing, so every person receives credit.
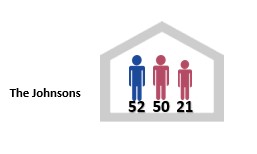
To help explain why Comscore demo impressions are generally higher than Nielsen’s, let’s continue to walk down our imaginary street to our final home. This HH has 3 people living in it. A 52-year-old male, a 50-year-old female and a 21-year-old female. The Johnson Family.
Imagine it’s “date night” at The Johnsons. Mr. and Mrs. Johnson head out for an early dinner. Their 21-year-old daughter is home alone watching the 5P Local News.
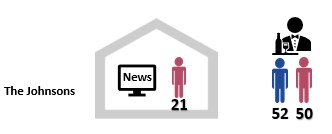
In a Nielsen measured TV HH, the daughter would be credited with viewing the 5P News. Her viewing will contribute to the Women 18-24 and the Adult 18-24. The folks are not home and aren’t watching the News, so they are not credited with any viewership.
Mr. & Mrs. J contribute 0 impressions. The Women 25-54, Men 25-54 and Adult 25-54 will not be credited with any audience data for this viewing situation.
In a Comscore measured TV HH, the HH will receive credit to all appropriate demo segments based on the HHs composition, regardless of who is watching. Remember, Comscore cannot determine who in the HH is watching. All of their demo segments are tied back to the viewing of the HH.
So, in addition to the daughter’s credit for HH with an Adults 18-24 (+ HH with Women 18-24), we will also see an impression credited to HH with Adult 25-54 (+ HH with Women 25-54 and HH with Men 25-54).
Let’s quickly recap the differences we focused on in this blog. Nielsen and Comscore have different demographic universe definitions. Additionally, each credit demographic viewing differently.
Nielsen measures and reports audience viewing for a demo. While, Comscore measures and reports audience viewing for a HH with a demo. Generally, this results in greater demo universe estimates under Nielsen and greater demo average audience estimates under Comscore.
As consumer media choices continue to become more fragmented, Nielsen and Comscore will need to continue to innovate. Both measurement companies need to juggle the challenges of pivoting quickly without jarring the buy/sell ecosystem, while also anticipating future developments that have yet to transpire. No easy task.
Local TV is still heavily transacted off age/gender. Quick...name a key demo! I bet you said, "Adults 25-54". Well, as I begin closing in on the number on the right side of the dash, I can't help but think of how different my life was when I was on the left side.
So, whether it's Adults 25-54 or HH with Adults 25-54, isn't it time that the industry starts looking at segments like: 43-year-old men who go food shopping on Saturday mornings?
As they evolve, you can bet they’ll each have their own “magic” on how to provide the most accurate estimates for their clients.
In the near future, we’ll reopen our activity book and “Spot more Differences” with you!

.png)


