
.png "Search Icon")
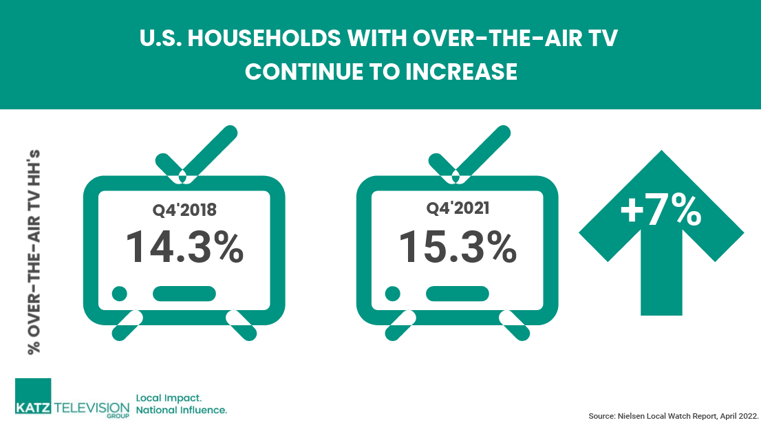
AS CORD-CUTTING CLIMBS, MORE HOUSEHOLDS GET THEIR LOCAL STATIONS OVER-THE-AIR
Cord-cutting continues to climb as consumers look beyond cable and satellite services for value as well as additional features. Nielsen's latest Local Watch report: The Over-the-Air Evolution, breaks down the trends in how Americans receive video content, with a focus on OTA households.
OTA households now top 18.6 million, or 15.3% of all U.S. TV HHs, a significant increase over 2018, where 14.3%, or 17M households, received television over-the-air.
Click for full screen
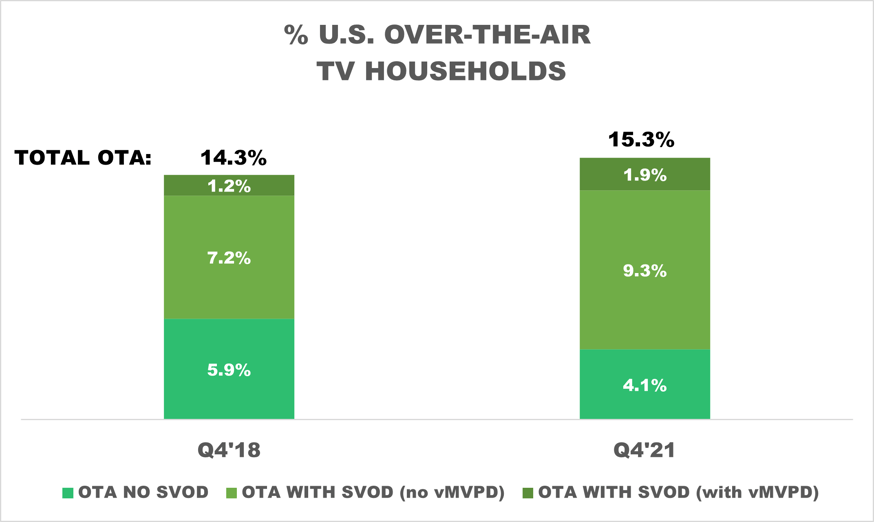
OTA HOMES BY SERVICES
OTA households often subscribe to other video services, either ad supported, subscriber supported, or a mix of the two. Nielsen breaks them out by SVOD (subscription video on demand like Amazon Prime, Hulu Plus, Netflix, Disney Plus) and vMVPD (virtual multichannel programming distributors like Hulu Live, YouTube TV, Roku).
Of the 15.3% of the country that falls into the OTA bucket, about a quarter of them only receive TV through an antenna. More than half of OTA homes also have a subscription service (like Netflix) but no other provider, and about a fifth have both an SVOD and vMVPD service.
Click for full screen
Over the same period Cable Plus homes (mostly hard-wired cable or satellite services), dropped from 76% to 57% of U.S. homes while Broadband-only homes made major inroads, increasing from 9% to 27%. Keep in mind that BBO homes may receive broadcast stations through a variety of services (Roku, FuboTV, Hulu+, YouTube TV).
Source: Nielsen Local Watch Report: The Over-the-Air Evolution, April 2022.
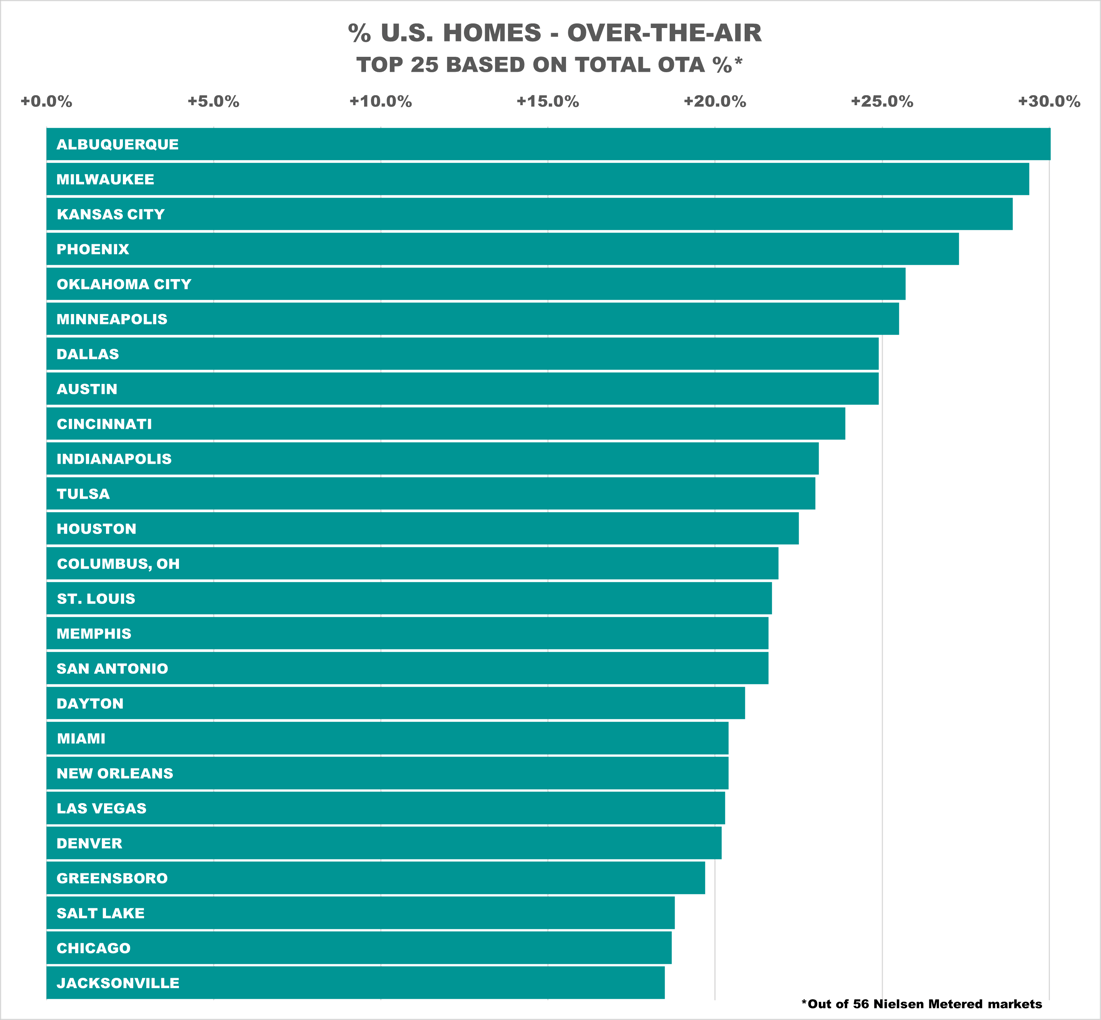
OVER-THE-AIR BY MARKET
Over-the-air penetration rates vary widely by market. It is dependent on numerous factors, including overall geography, urban vs rural population centers, investment by cable/satellite providers and overall household economic factors. While most markets saw significant growth in OTA HH's, the impact is far greater in some markets. Nielsen quantifies the rates for the 56 metered markets in this report. Percentages vary from 8% in Boston to a high of 31% in Albuquerque. The data includes penetrations rates for OTA-only HHs, those with SVOD and/or vMVPD (only totals included in chart).
Albuquerque, Milwaukee, Kansas City, Phoenix, and Oklahoma City round out the top OTA markets. But just looking at total OTA penetration is not the whole story. Austin is the 8th ranked metered market in OTA penetration, but is the No. 1 market for OTA homes with an SVOD and vMVPD service at almost 7%. Given Austin’s reputation as a young, growing city, and the recent transplant of Tesla, it makes sense that this OTA segment is so large. The younger, higher income, family profile fits well. Phoenix is considered one of the fastest-growing big cities, with 160,000 newcomers from 2010 to 2020, and in that
timeframe, OTA has been a continued large portion of the TV universe. Finally, Albuquerque with an exceptionally diverse population tops two OTA categories, OTA No SVOD (no vMVPD), and
OTA with SVOD. -Nielsen Local Market Report
OTA HOMES BY MARKET (METERED MARKETS ONLY) RANKED BY %
Click for full screen
LOCAL NEWS VIEWING IN OTA HOMES
While OTA households tend be heavier local news viewers, the difference is not at great as might be expected. A Nielsen survey showing frequency of local news viewing in both OTA and non-OTA households show a 4%-7% point difference between them. This means local news is heavily viewed regardless of how the household receives the stations.
click for full screen

Source: Nielsen Local Watch Report: The Over-the-air Evolution, April 2022.


